
In short: On this page, you can view detailed information about how much electricity your home is using. If you have a smart EV charger that is controlled by FlexiO, the charging consumption will also be shown separately in green.
The consumption graph explained:
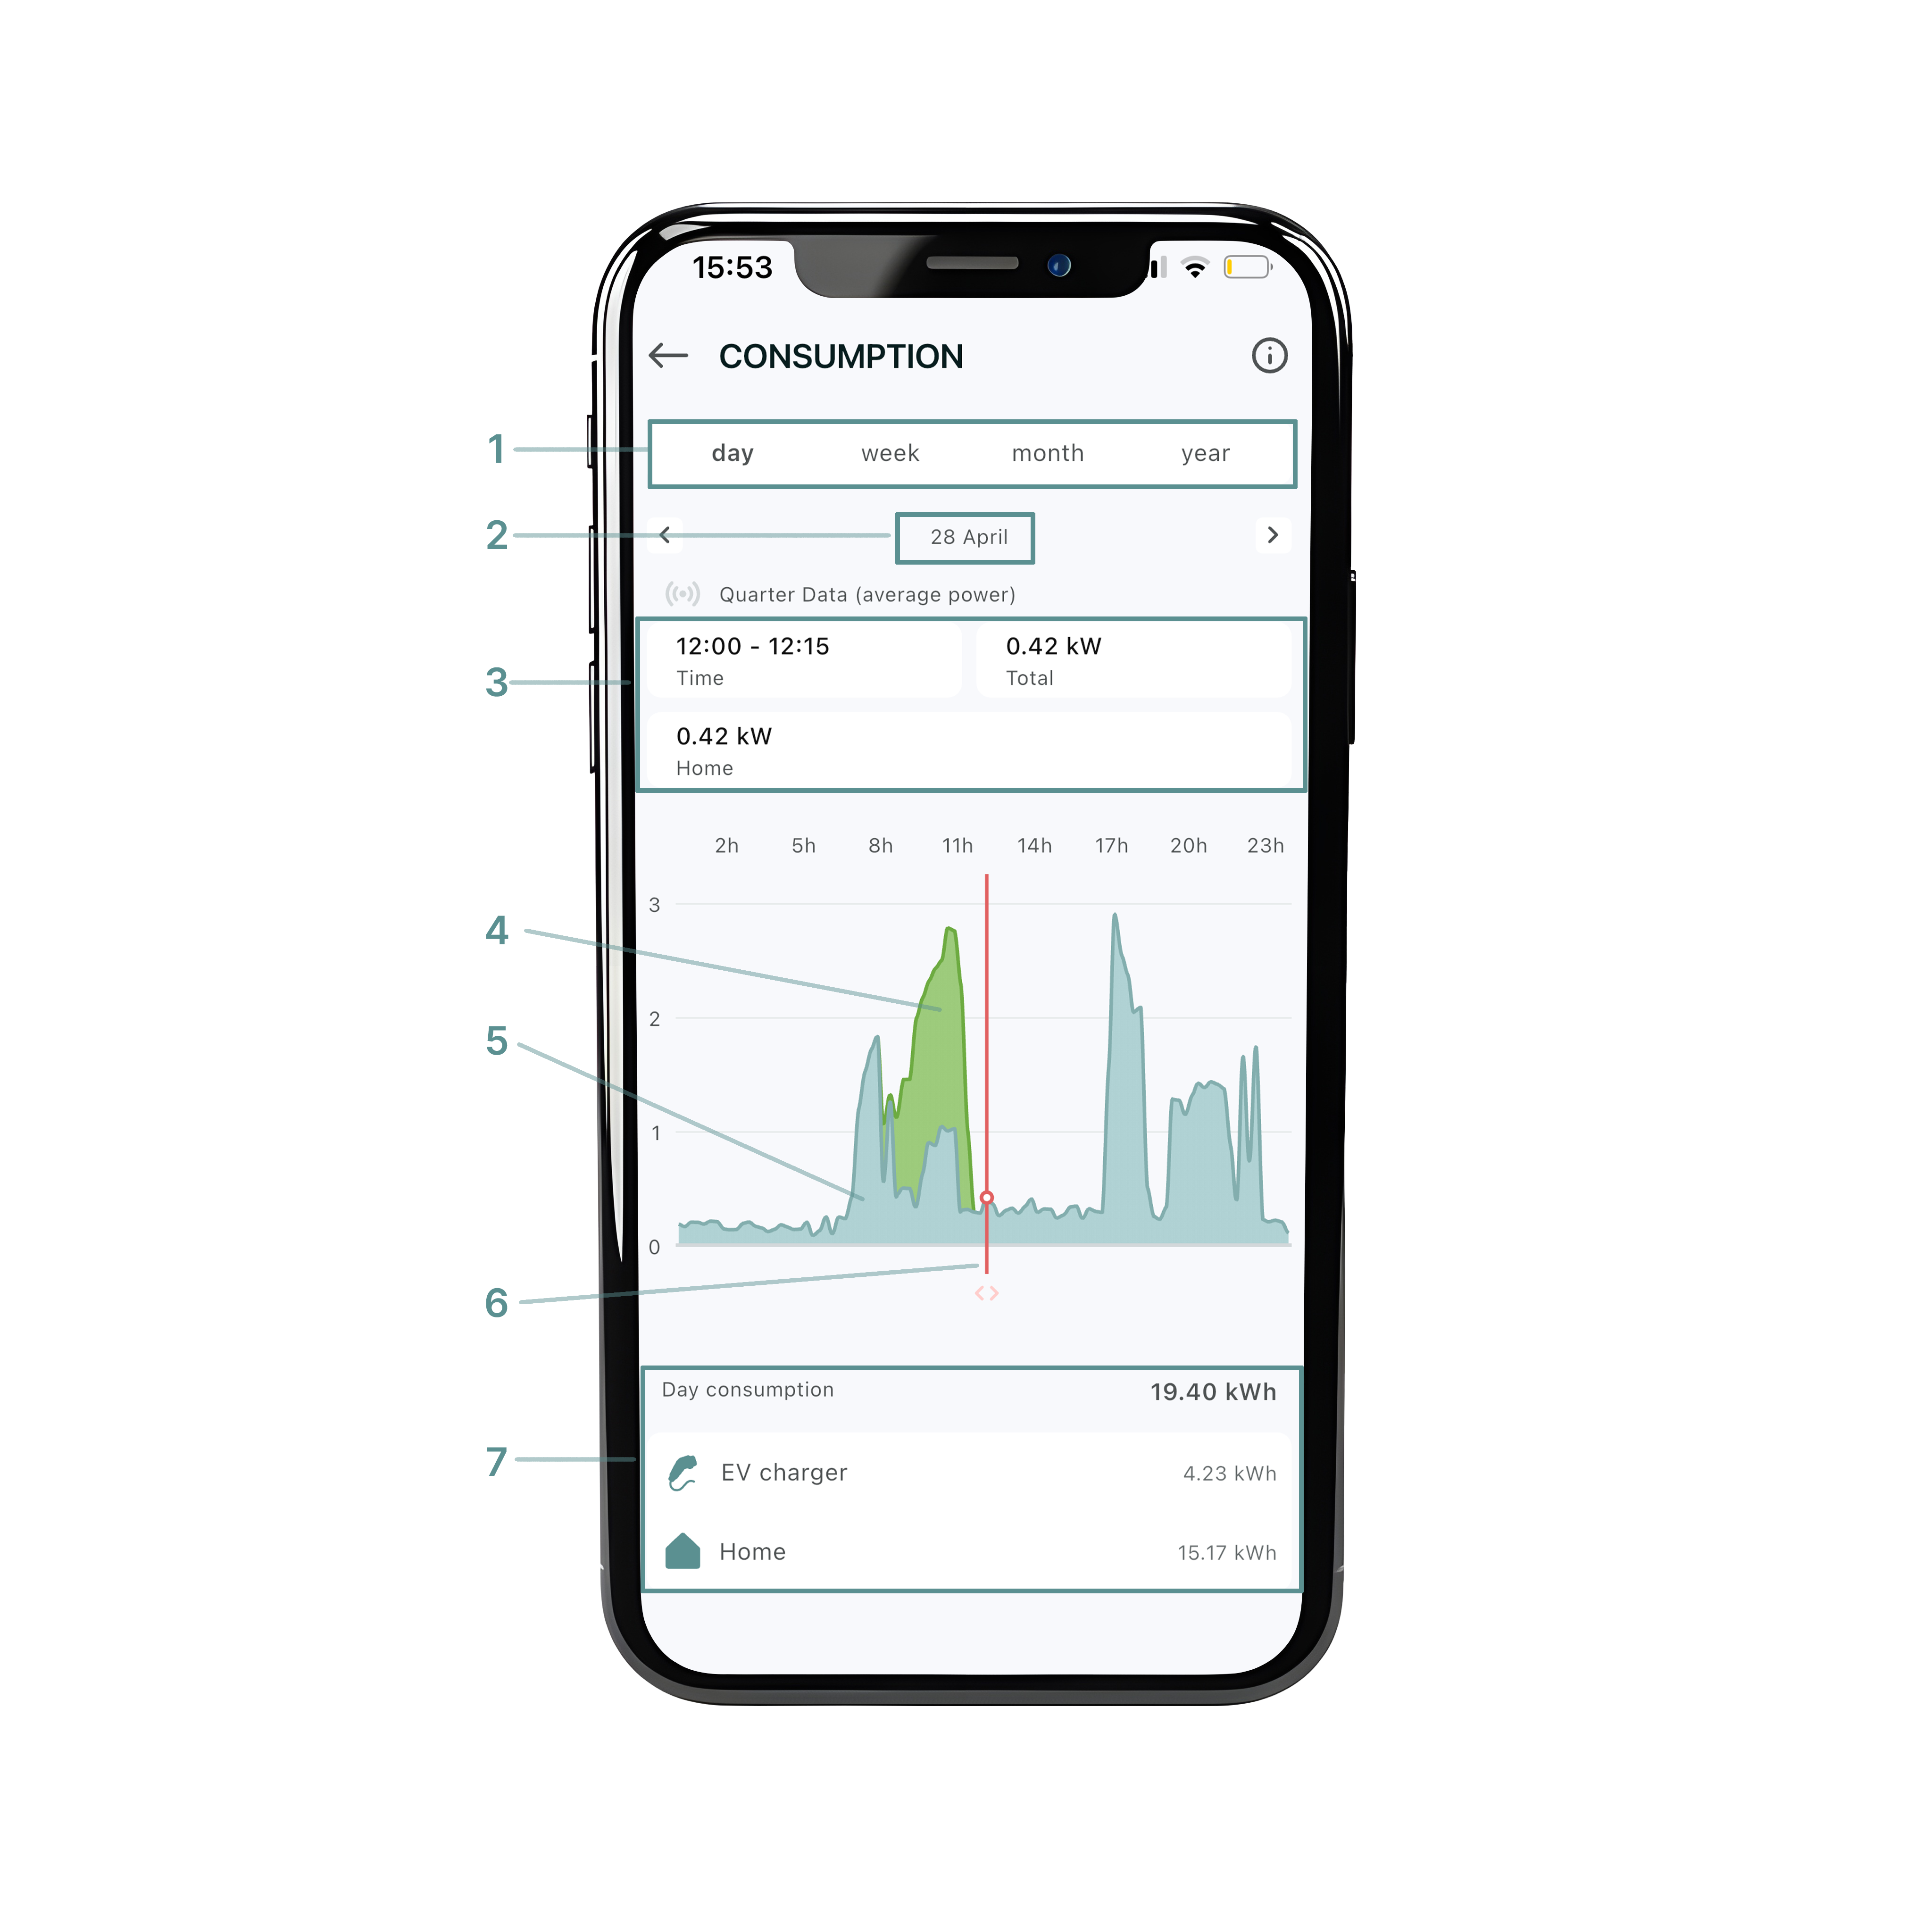
Selecting a time period (1)
At the top of the screen, you can choose the period you want to view (day, week, month or year).
By default, the app shows today's data. If you want to view a different day or period, tap "the selected date" (2) and navigate to the desired date.
Viewing detailed information
The numbers displayed above the graph show the exact consumption values for the selected moment (15-minute interval) (3)
Below the graph, you'll find a slider with a red vertical line (6). You can move this line left or right to select a specific moment or time block.
-
In day view, you will see the average power consumption per 15-minute interval.
-
In week, month, or year view, you will see the total energy used for each day, week, or month.
EV Charger (4)
If you have an EV charger controlled by FlexiO, you will see separately how much electricity your car has consumed for charging.
Home (5)
This represents the total electricity consumption of your home, excluding the consumption from charging your electric vehicle.
Note: this shows how much electricity was used, but not whether it came from the grid, your solar panels, or your battery.
Total overview (7)
At the bottom of the page, you will find the total consumption values for the selected period:
-
Total home consumption
-
Total EV charger consumption (if applicable)
The totals are displayed in kilowatt-hours (kWh).