
In short: On this page, you can view how much energy your home has taken from or injected into the grid.
The graph gives you a clear overview for the selected period.
The grid graph explained:
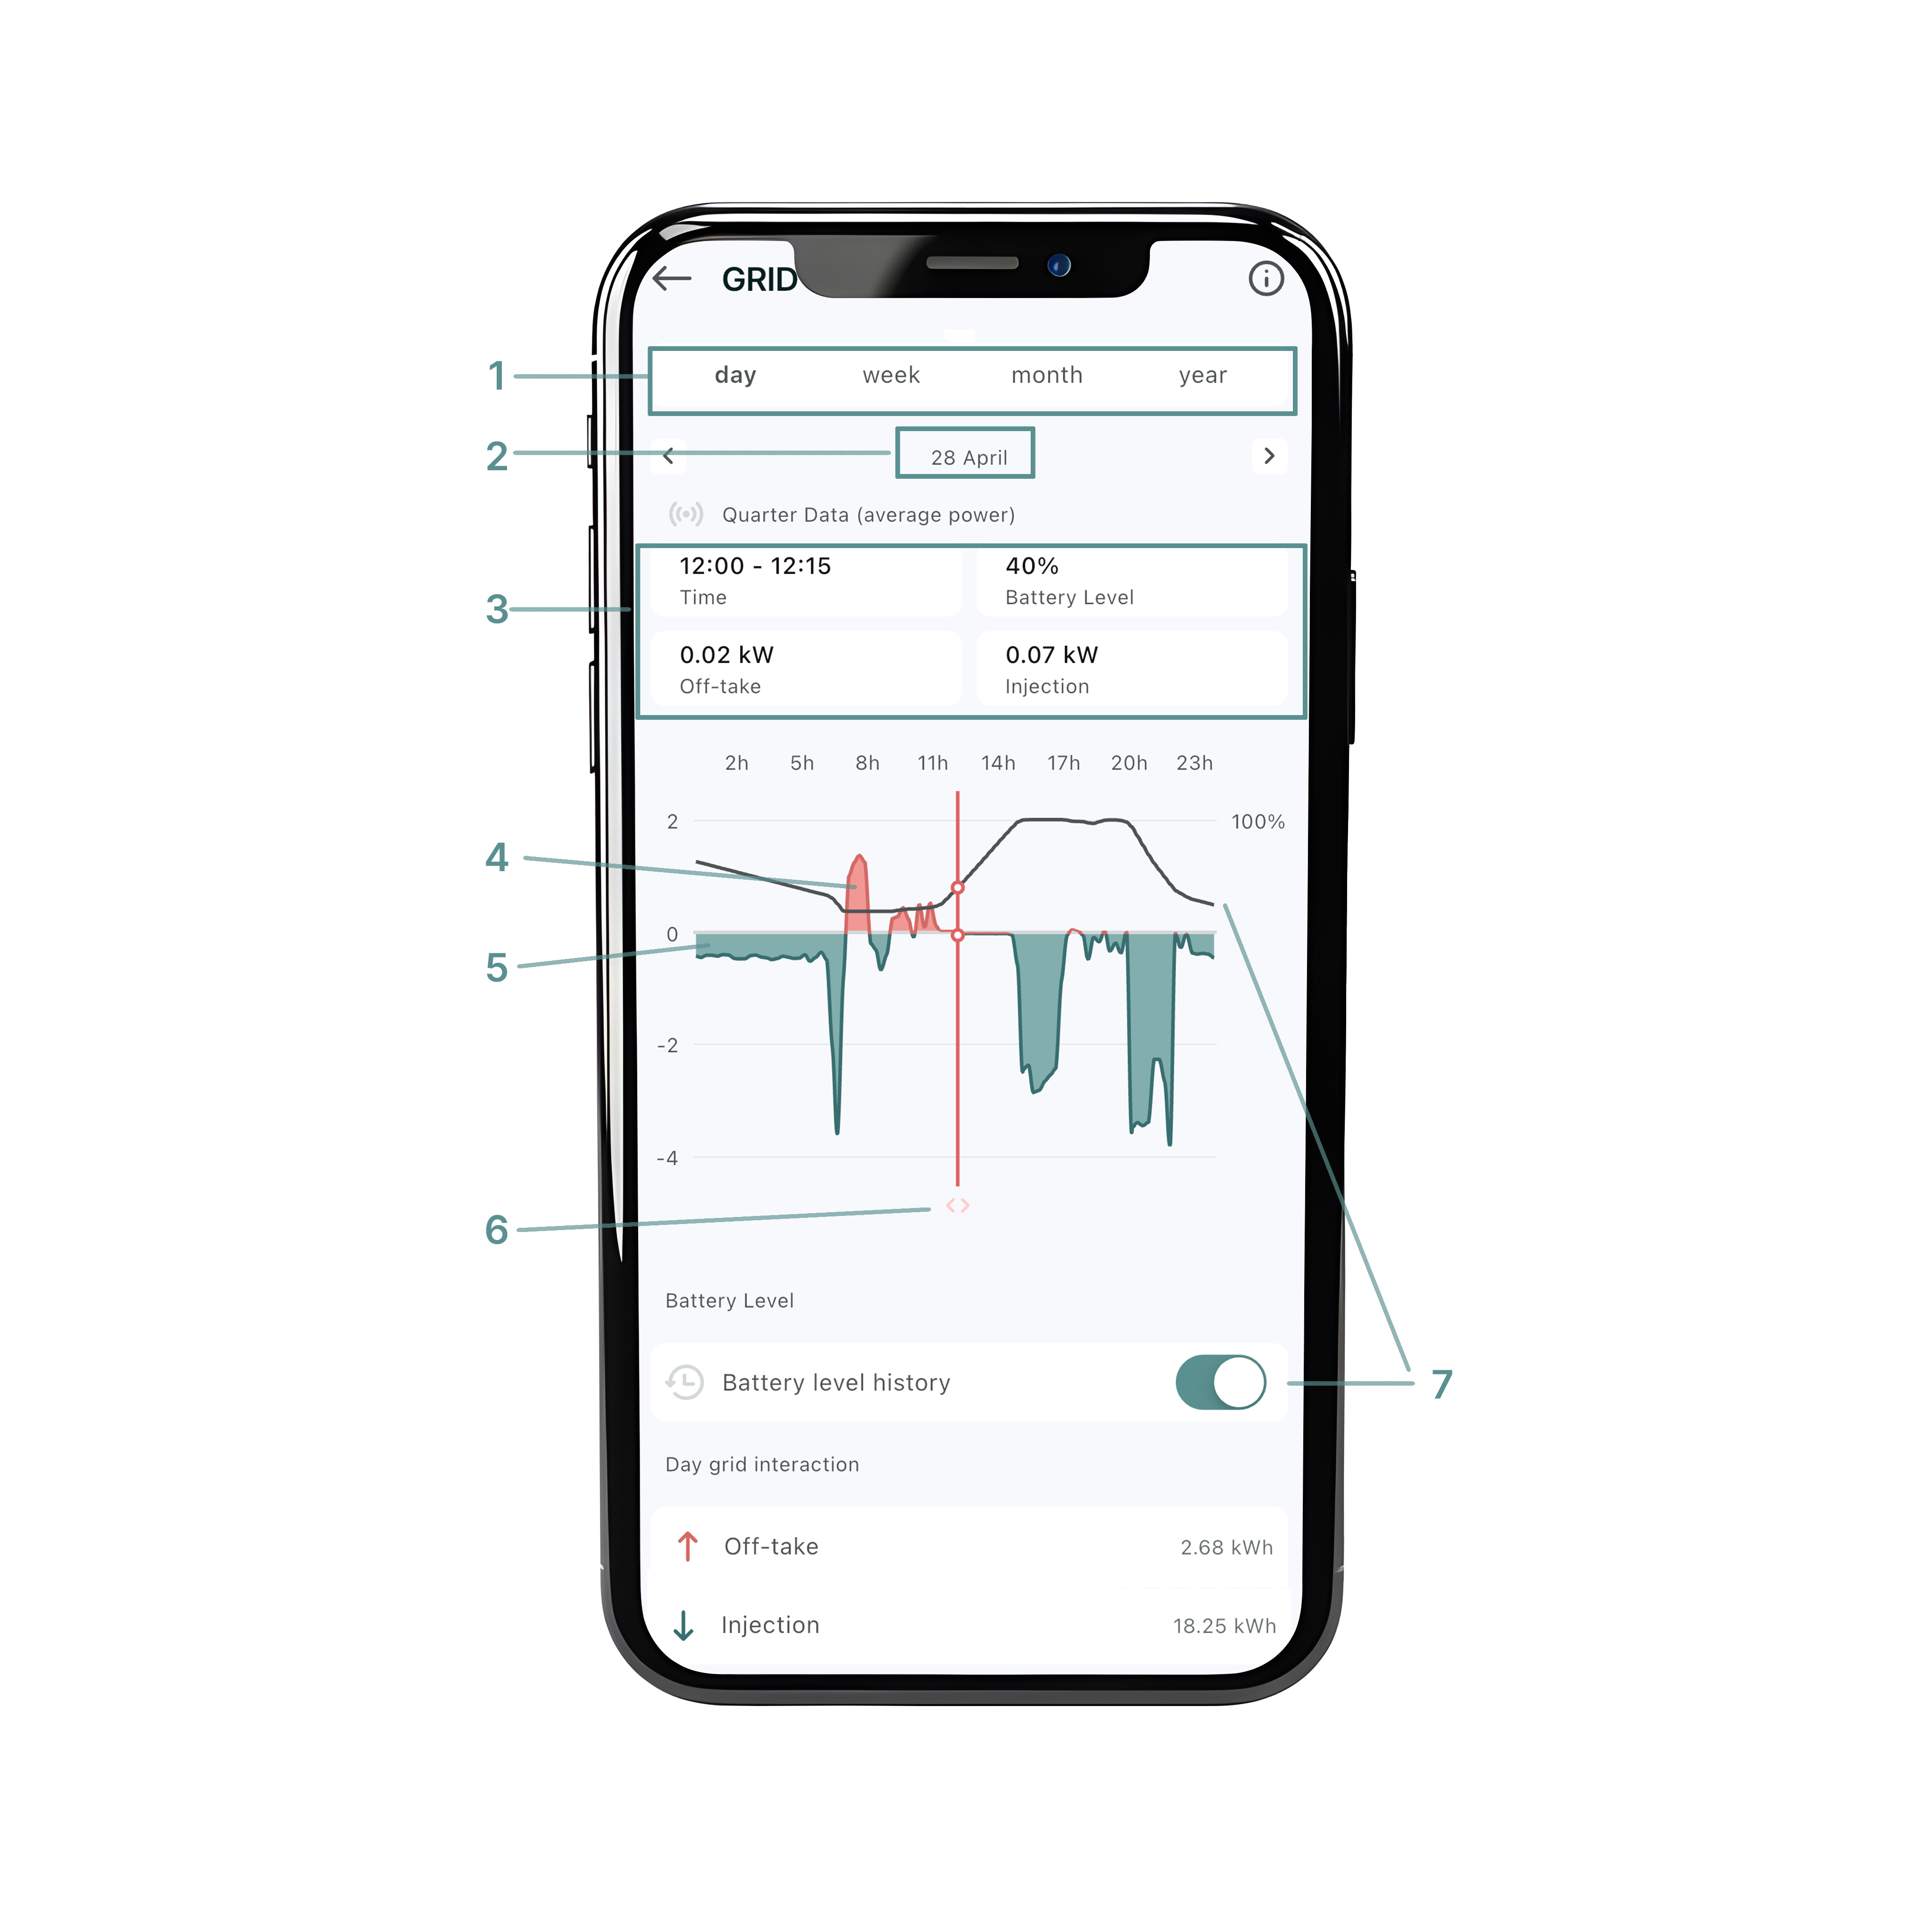
Selecting a time period (1)
At the top of the screen, you can choose the period you want to view (day, week, month or year).
By default, the app shows today's data. If you want to view a different day or period, tap "the selected date" (2) and navigate to the desired date.
The numbers displayed above the graph show the exact off-take and injection values for the selected moment (15-minute interval). When you have a battery, you can also see the battery level. (3)
Below the graph, you'll find a slider with a red vertical line (6). You can move this line left or right to select a specific moment or time block.
-
In day view, you will see the average total off-take and injection per 15-minute interval.
-
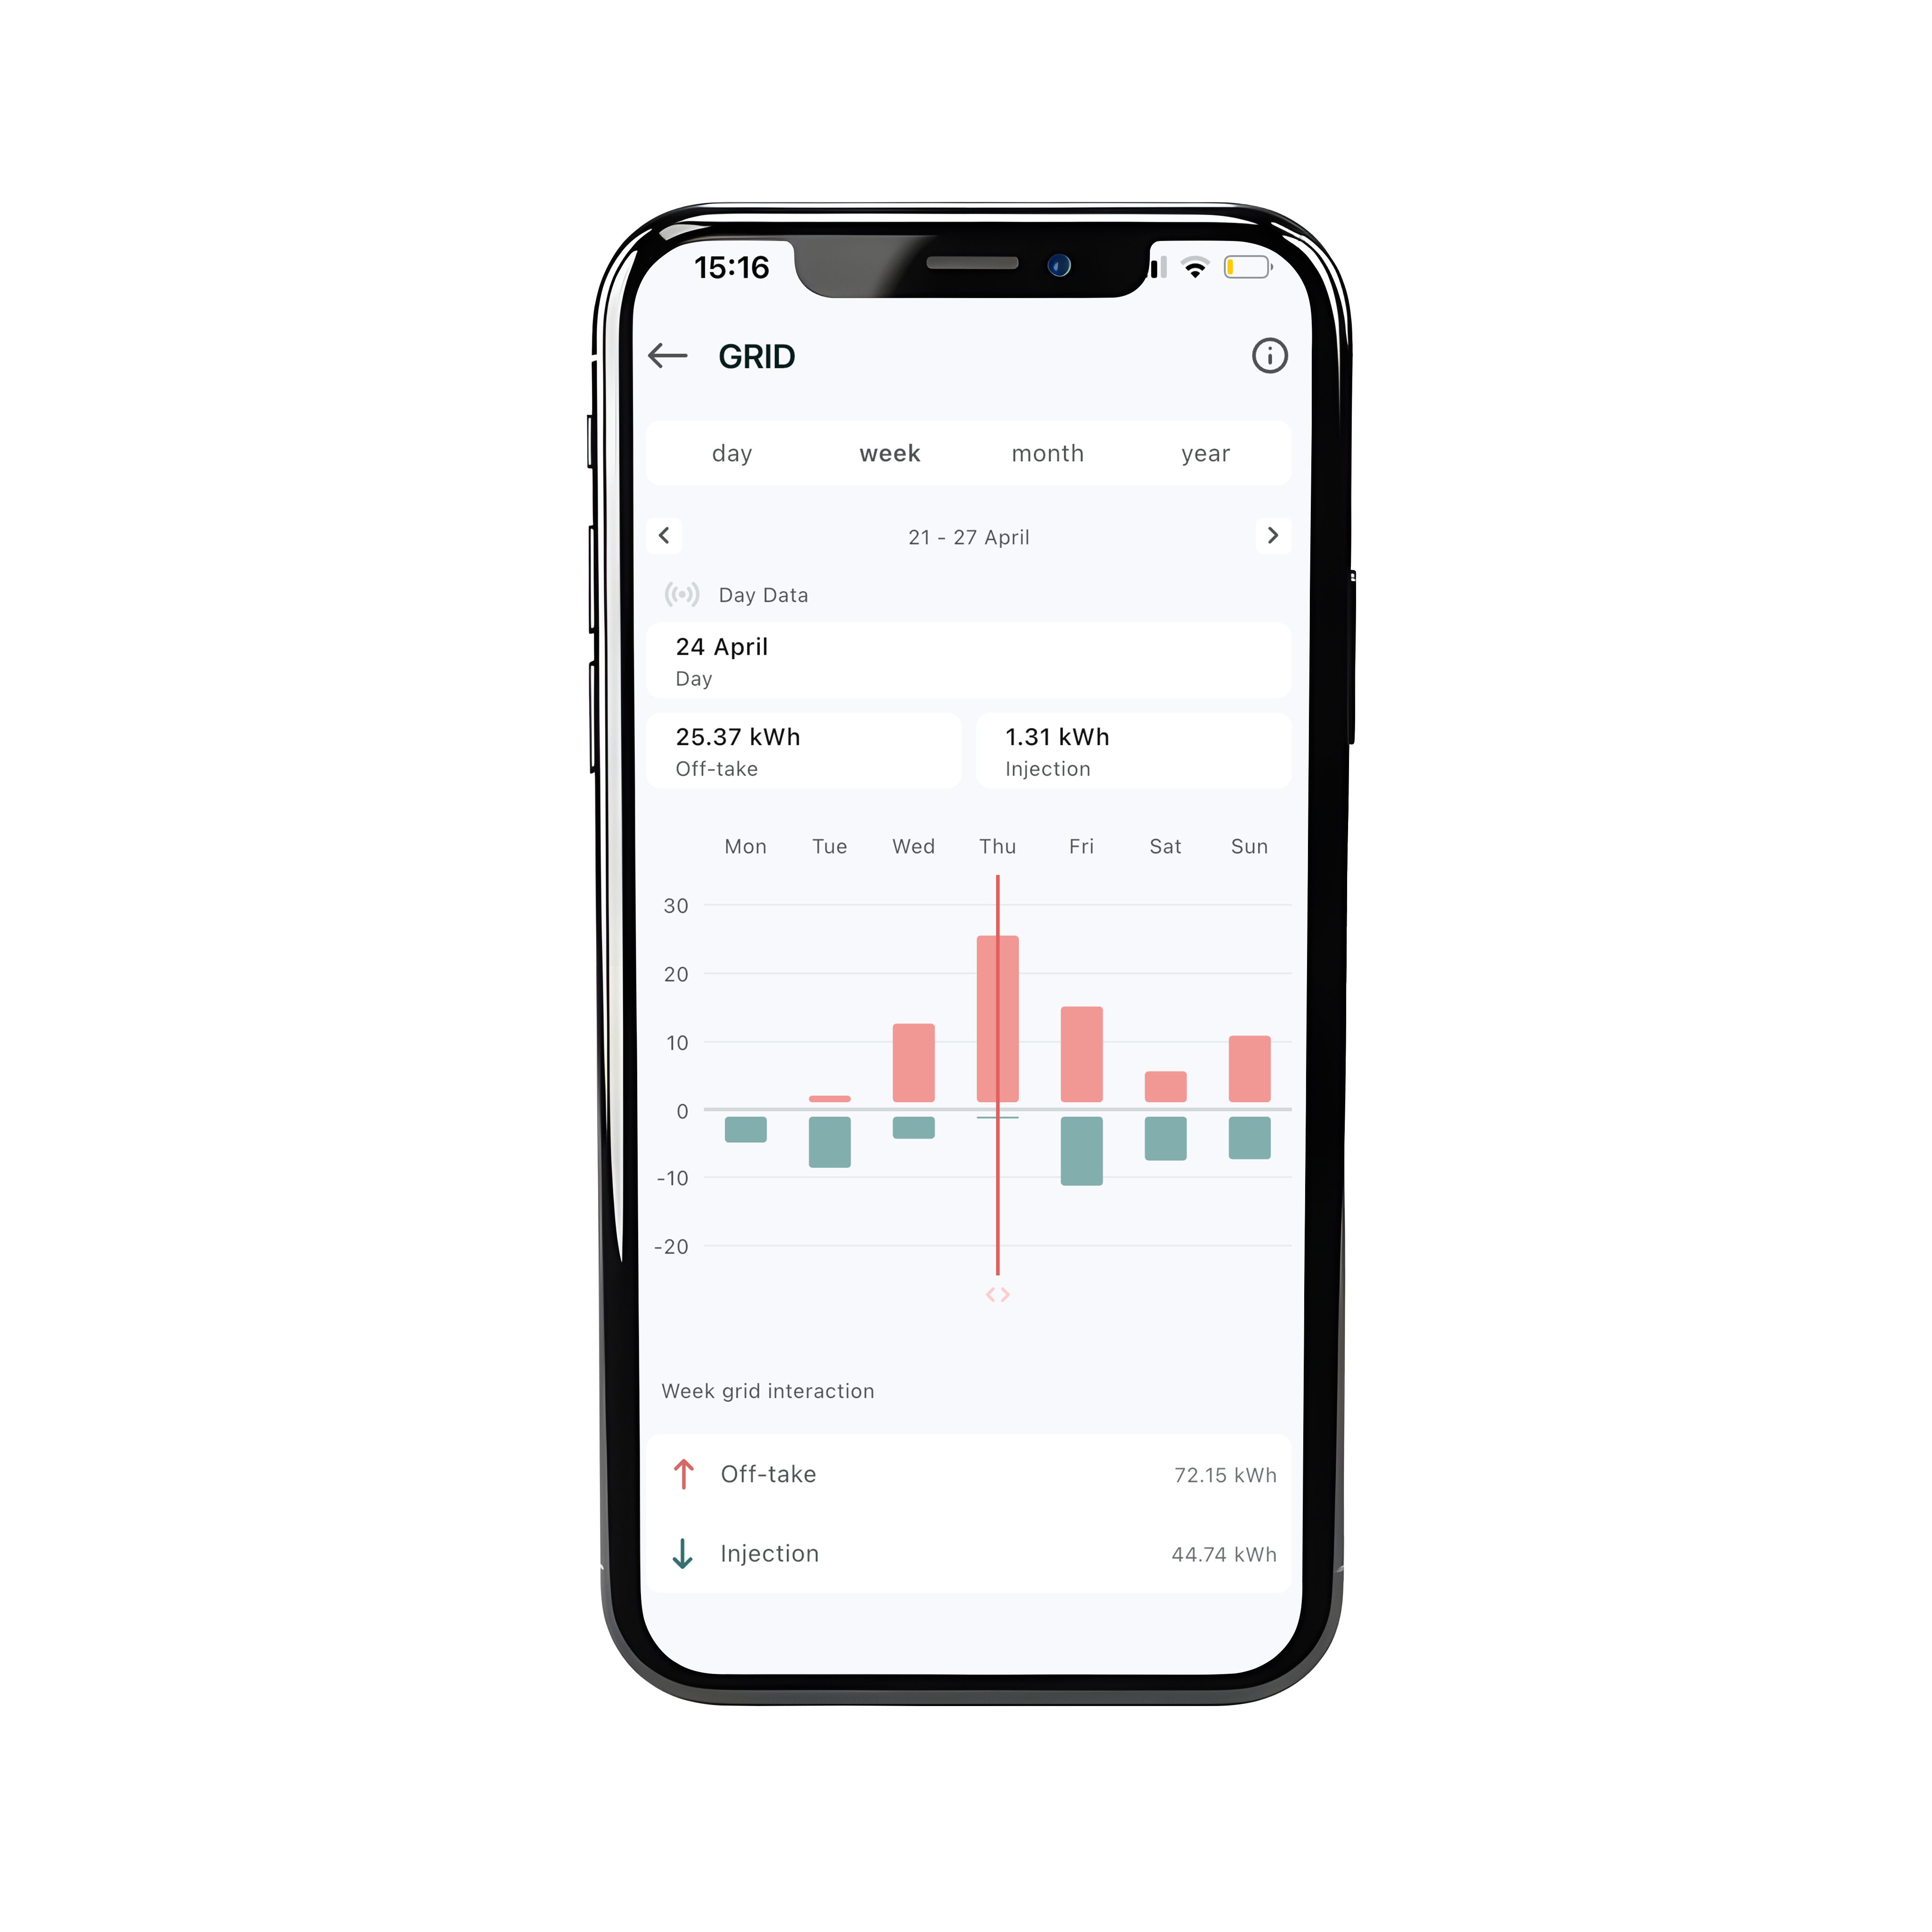
In week, month, or year view, you will see the total off-take and injection for each day, week, or month.
Data on the Graph
Grid Consumption (4) represents the amount of energy you are buying from your energy supplier.
Grid Injection (5) represents the energy you are selling back to the energy supplier.
Battery level (7): you can switch on or off the battery level to reveal an extra graph to see your battery charging history.
Total Overview: At the bottom of the page, you’ll find the total values for the selected period, divided by data type:
-
Grid consumption
-
Grid injection
Graph Layout
-
Day view shows a line graph with power (kW) on the Y-axis and time blocks on the X-axis.
-
Week, month, and year views show bar graphs with energy (kWh).
Extra information about the data:
Grid Consumption (4)
Shows how much energy you have drawn from the public grid.
This is energy that was not supplied by your solar panels or battery.
Grid Injection (5)
Shows how much energy you have injected back into the public grid.
This can be excess solar production or energy discharged from your battery (e.g., for grid balancing).
Battery Level History (7) (optional)
Shows the charging status of your battery throughout the day (as a percentage).
By default, this is hidden.
You can make it visible by tapping the "Battery Level History" button.
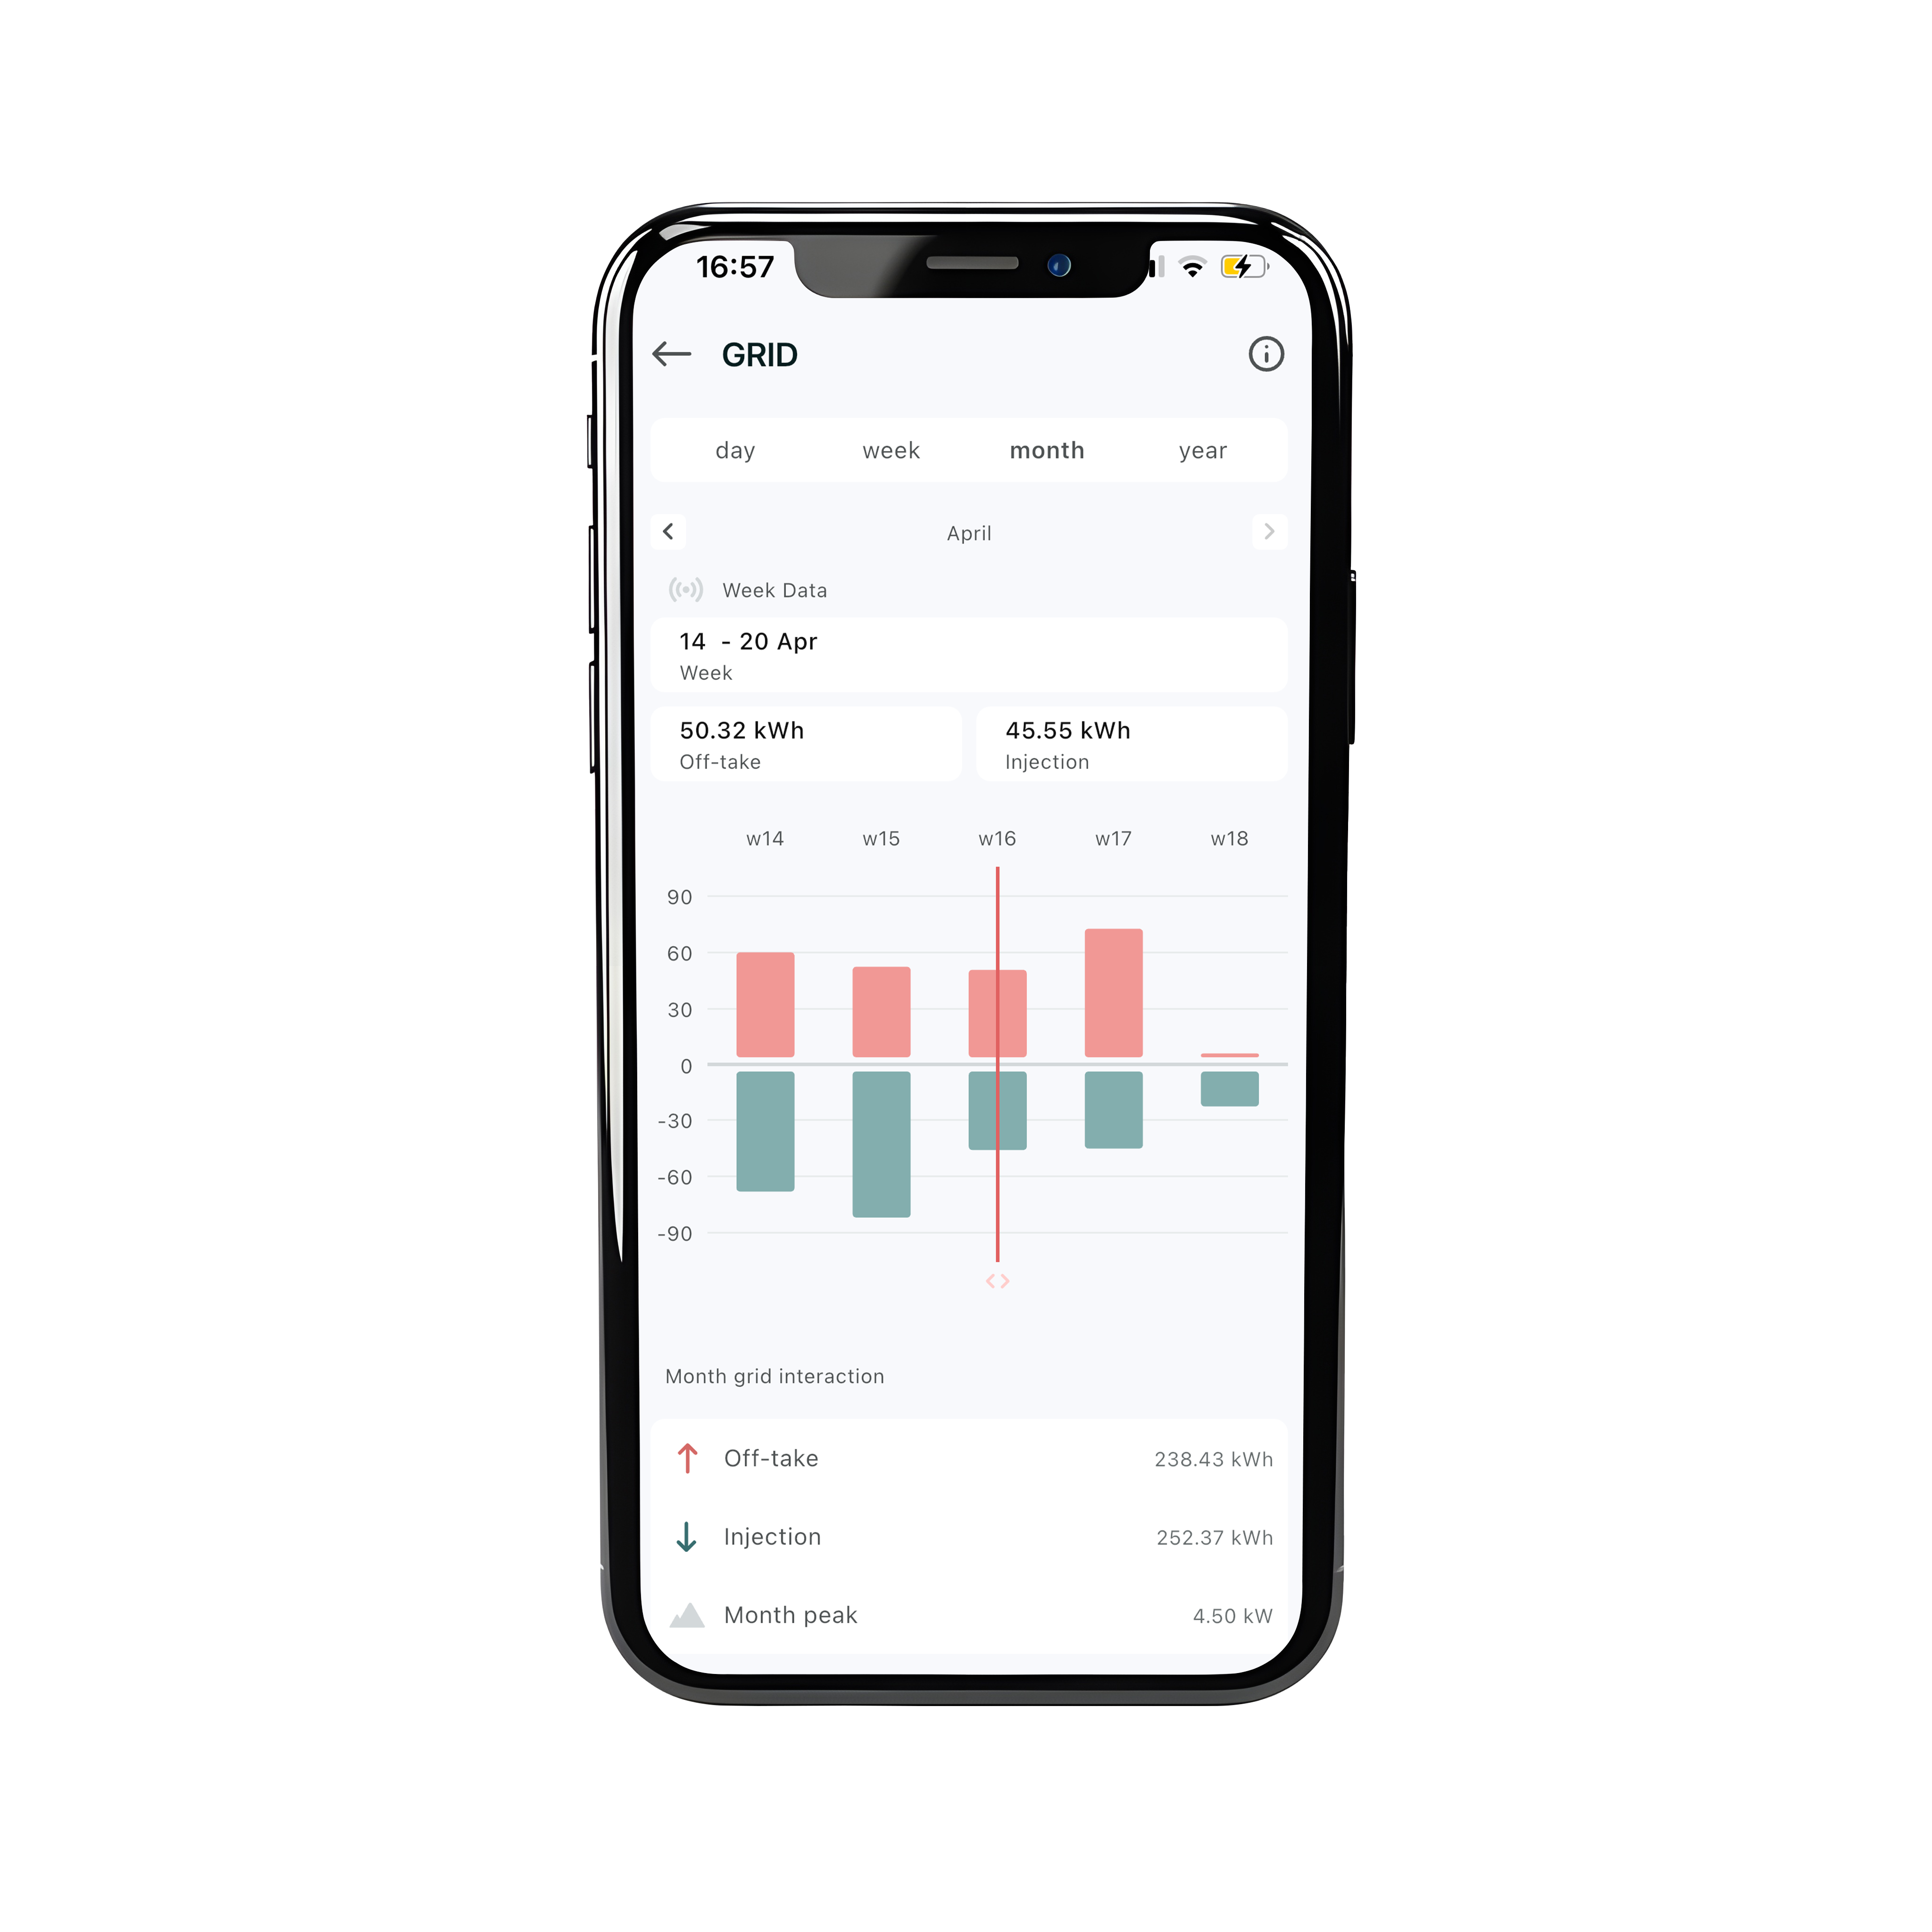
Special Note: Monthly Peak
The monthly peak (the highest amount of grid consumption during a month) is currently only available in the month overview. See image below:
Net Consumption and Grid Balancing
In some cases, you may still see grid consumption even when there is sufficient solar production or battery energy. This happens due to grid balancing. FlexiO will always choose the data flow that provides the greatest savings for the user.