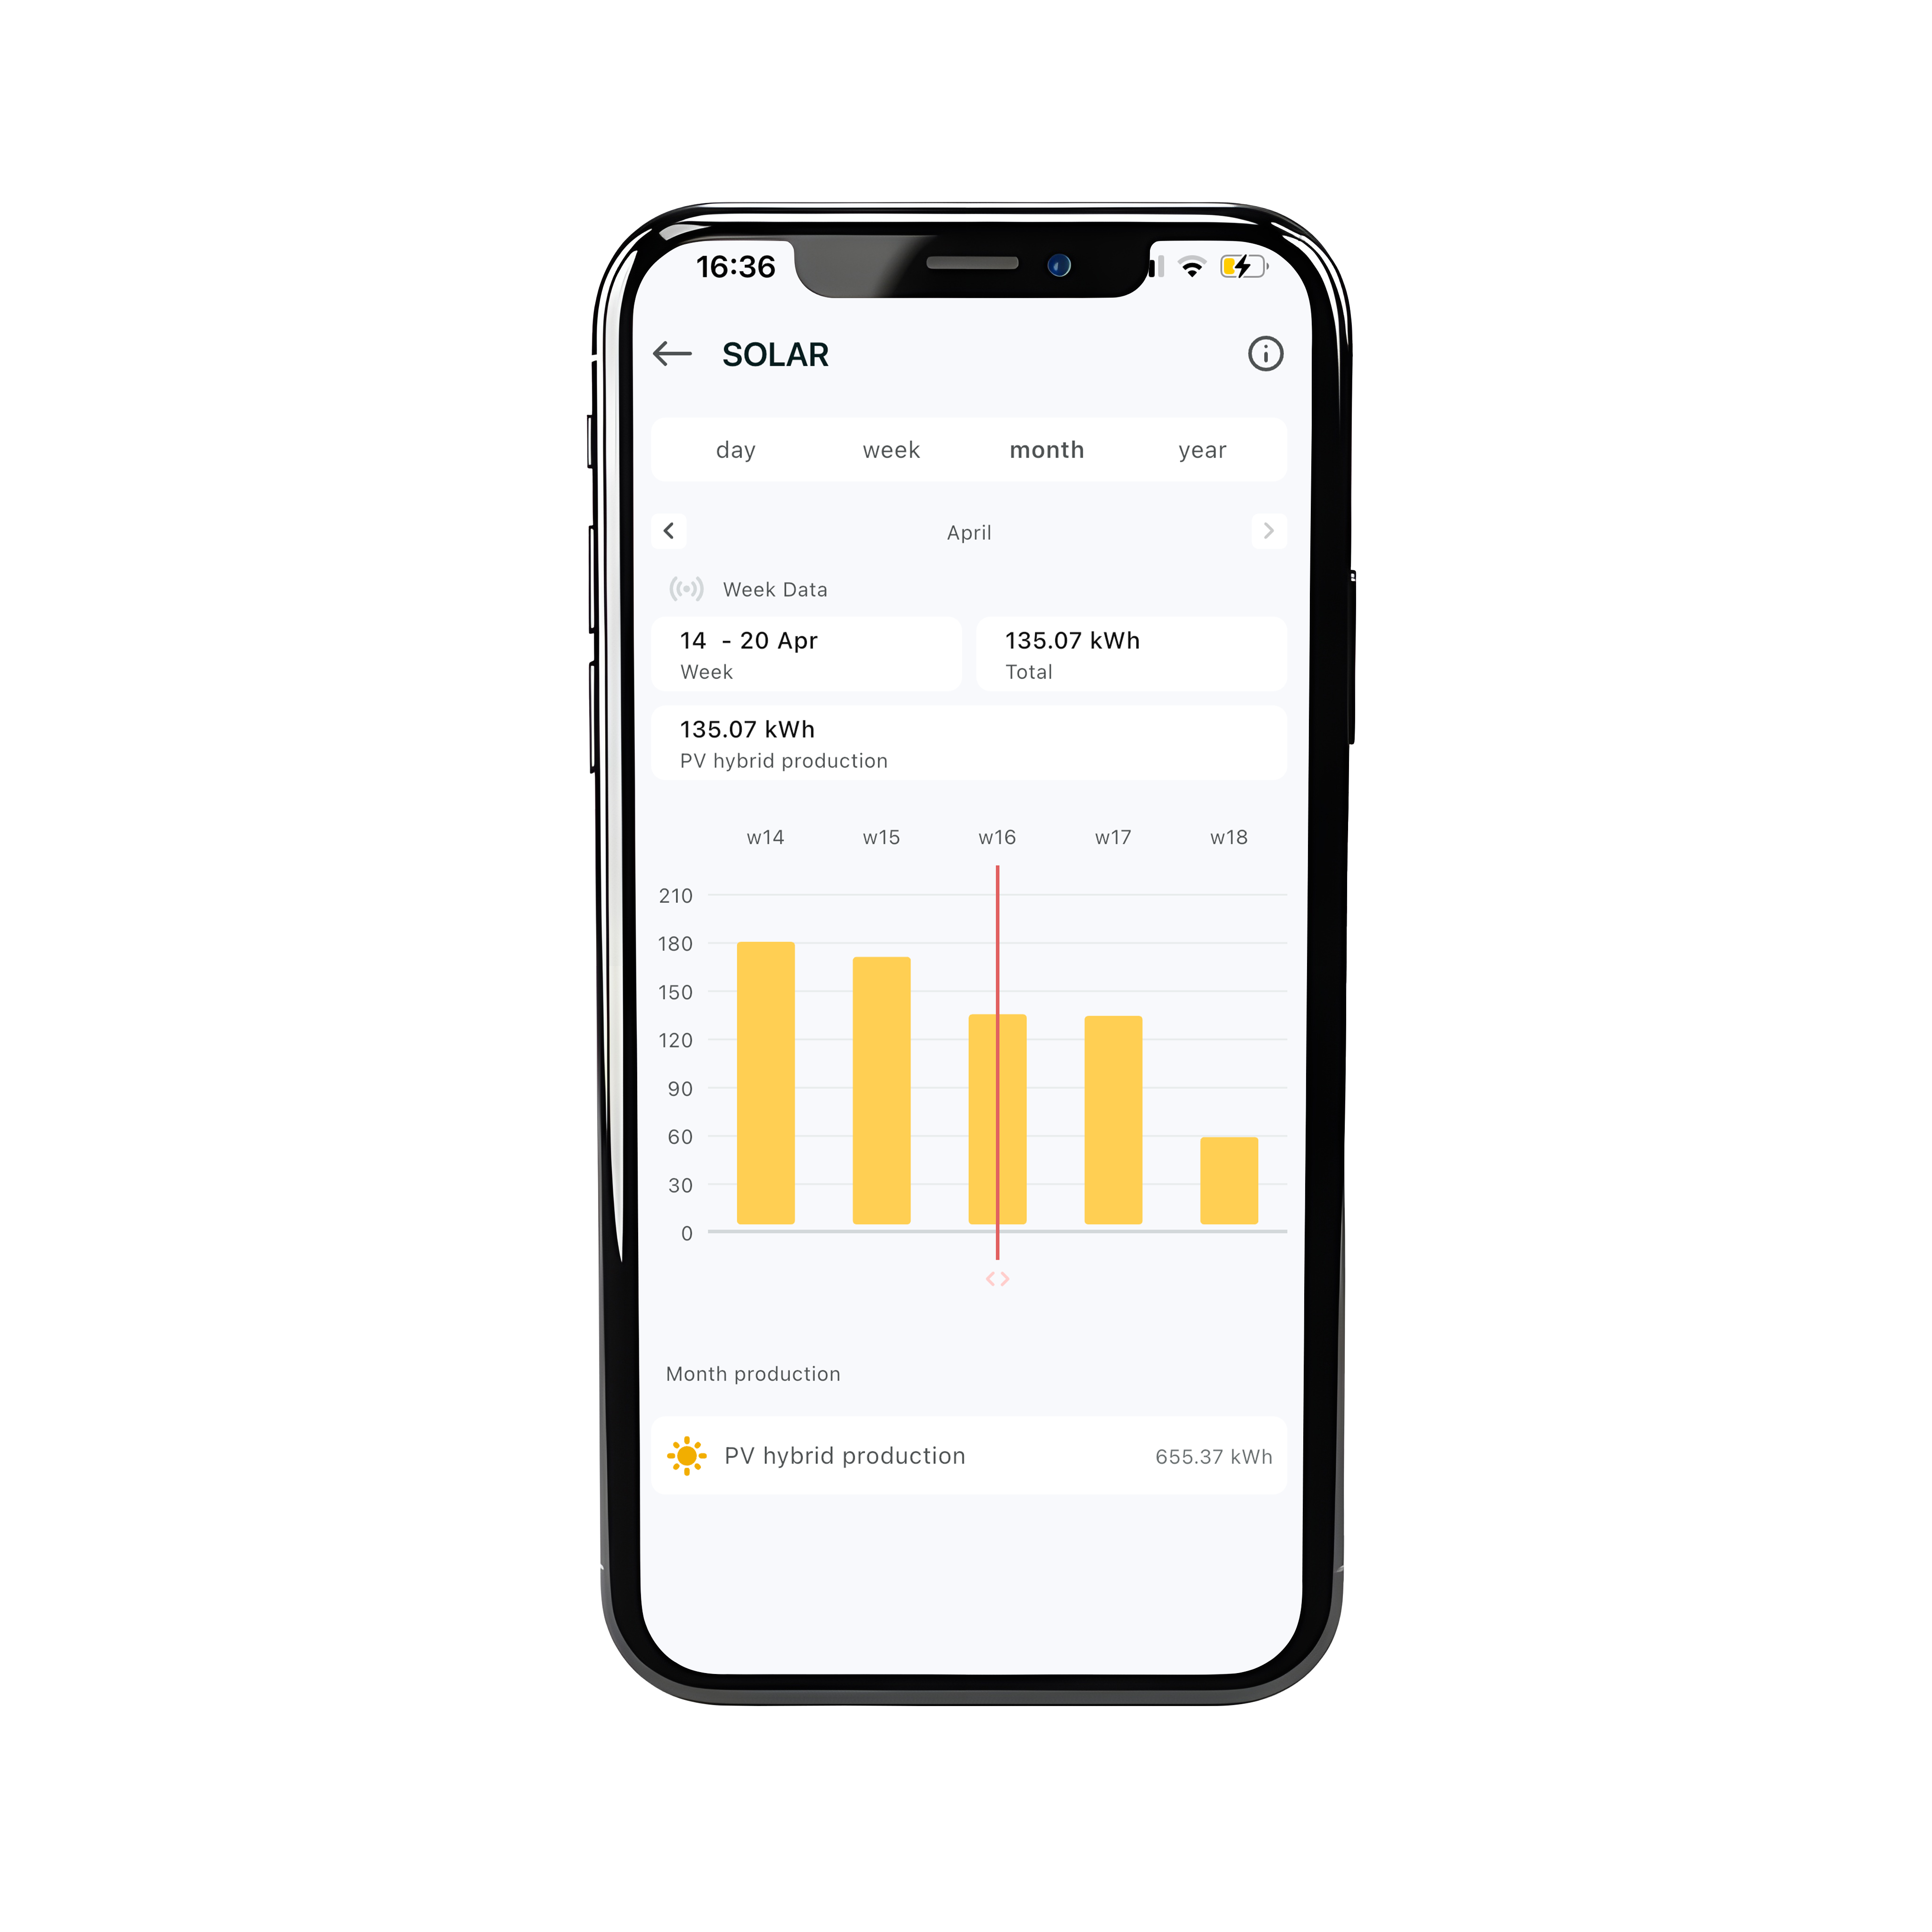
In short: On this page, you can see how much solar energy your home has produced.
The graph clearly displays the solar production for the selected period.
The solar graph explained:
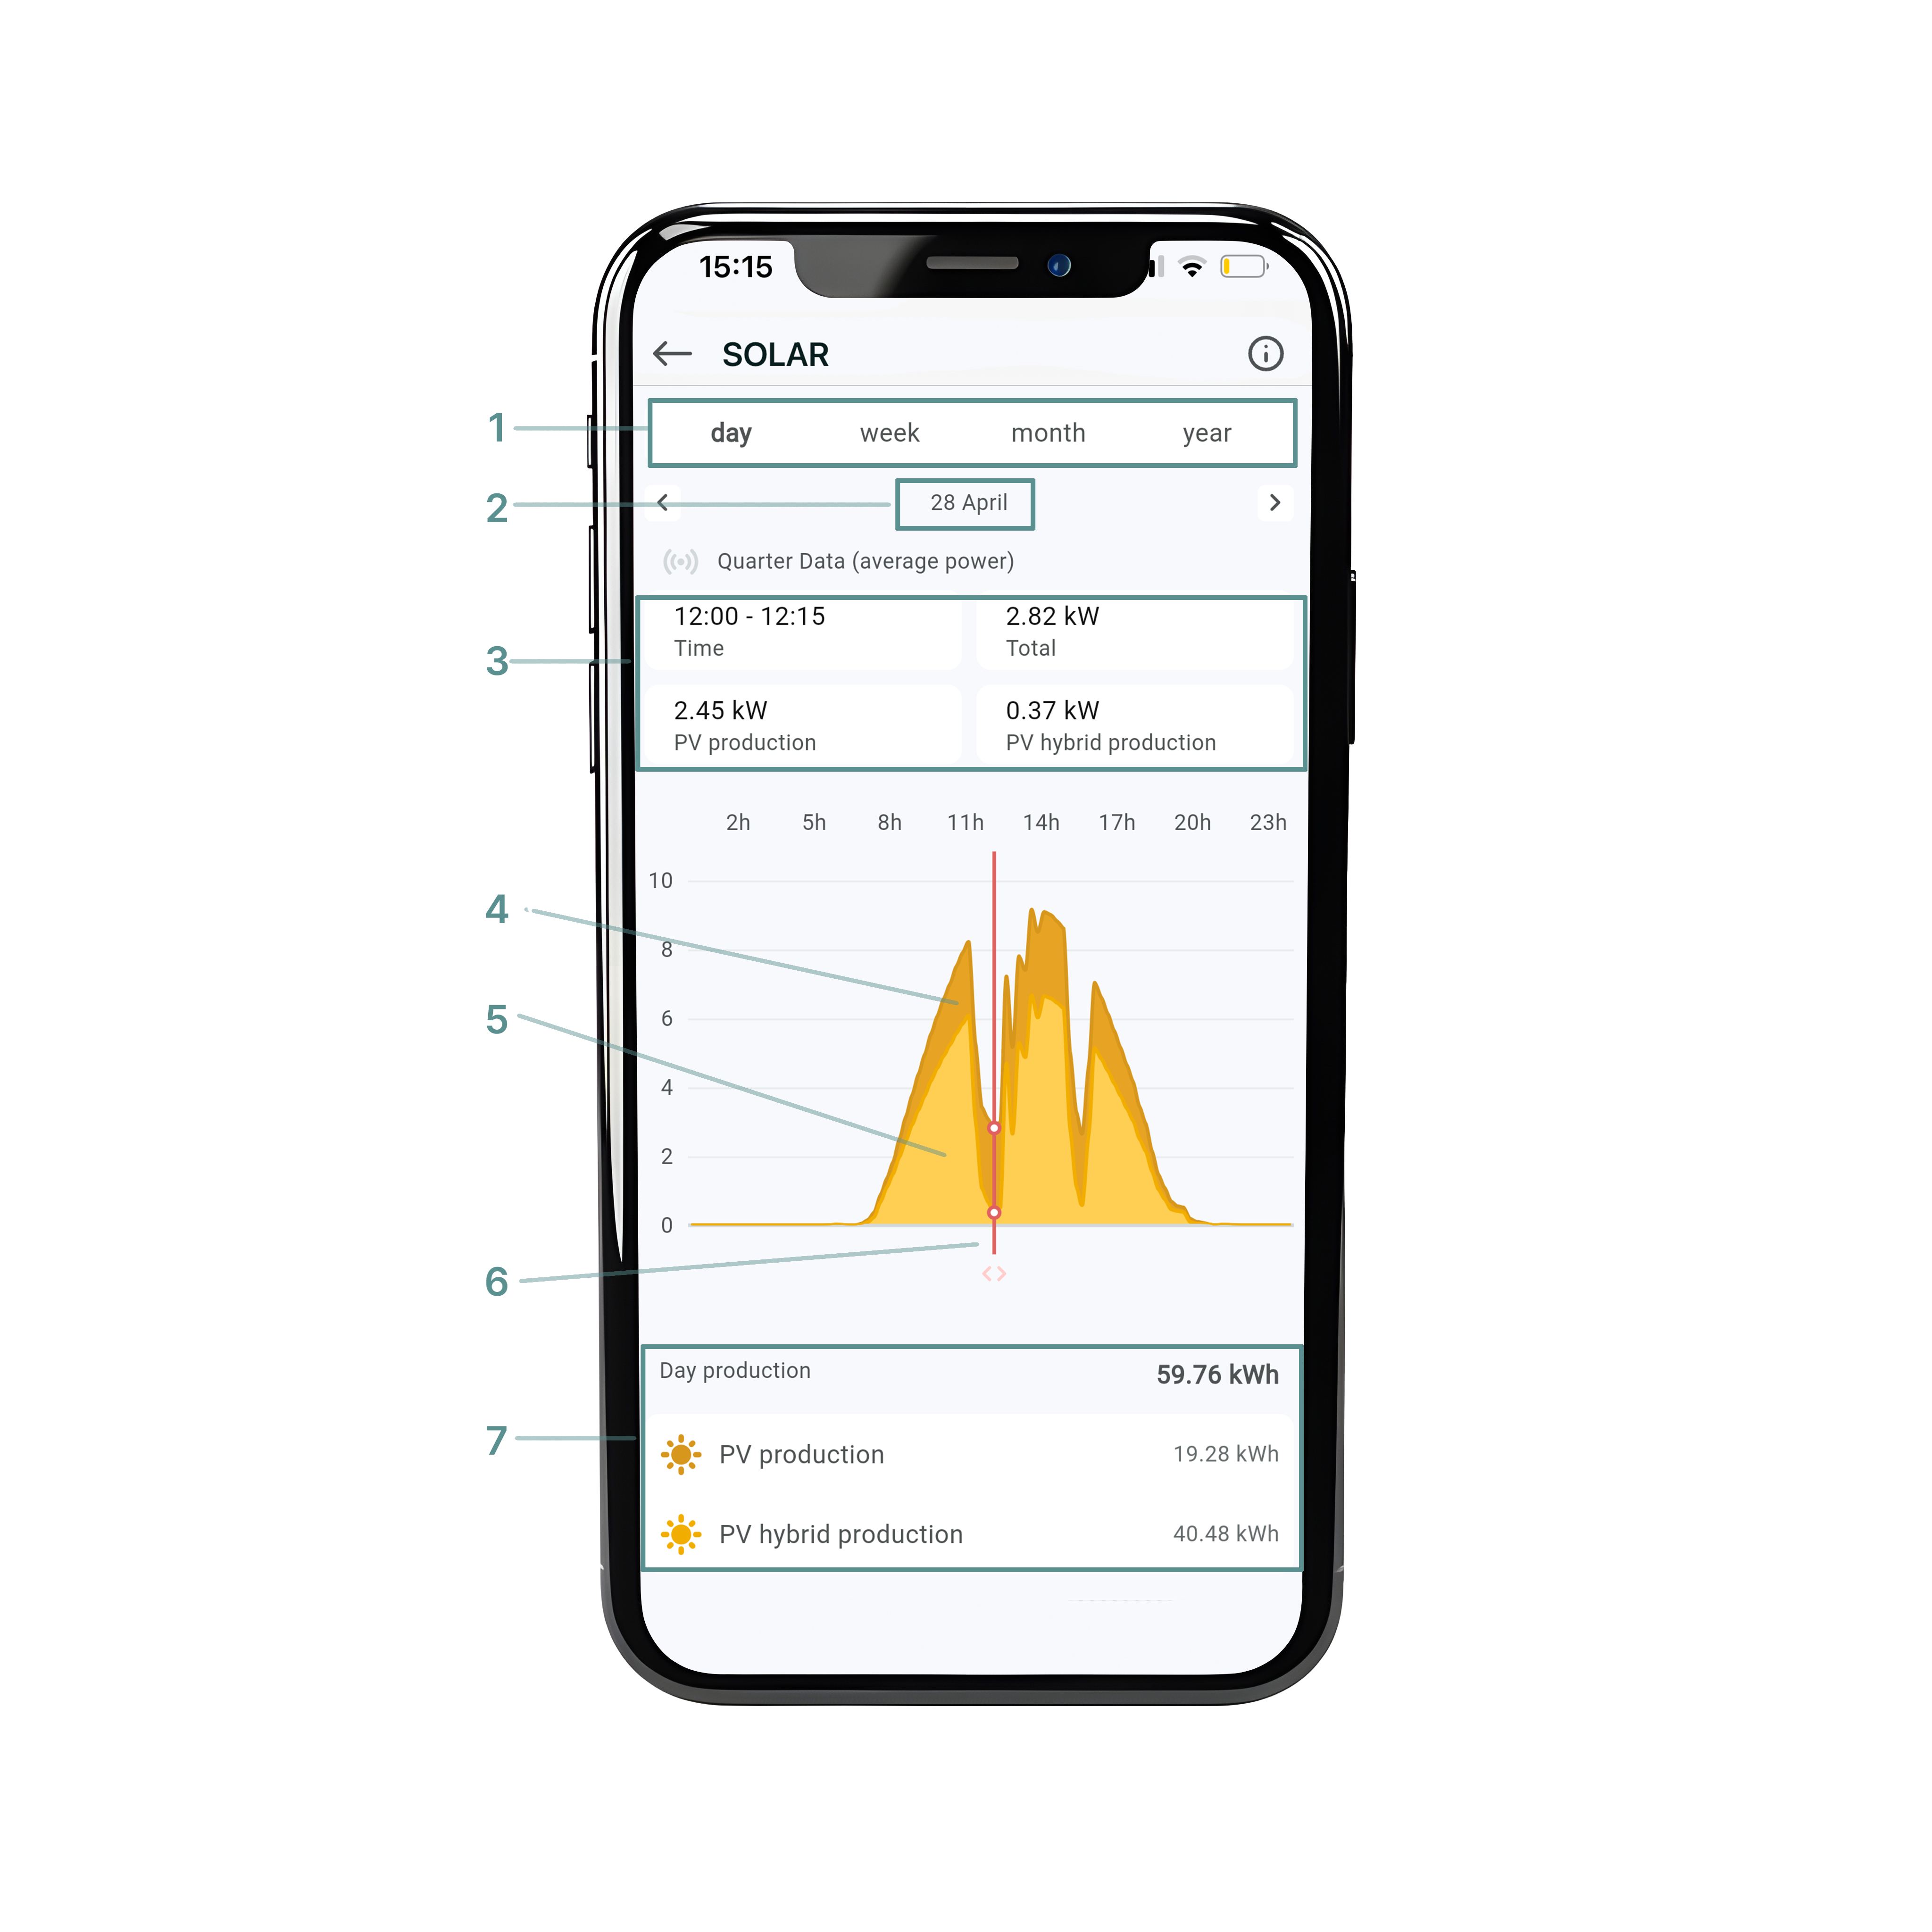
Selecting a time period (1)
At the top of the screen, you can choose the period you want to view (day, week, month or year).
By default, the app shows today's data. If you want to view a different day or period, tap "the selected date" (2) and navigate to the desired date.
The numbers displayed above the graph show the exact consumption values for the selected moment (15-minute interval) (3)
Below the graph, you'll find a slider with a red vertical line (6). You can move this line left or right to select a specific moment or time block.
-
In day view, you will see the average solar production per 15-minute interval.
-
In week, month, or year view, you will see the total solar energy produced for each day, week, or month.
Total overview (7): At the bottom of the page, you find the total solar energy produced for the selected period, divided into:
-
PV hybrid production
-
PV retrofit production
Understanding the types of solar production
If your home has multiple solar inverters, the app distinguishes between two types:
-
PV hybrid production (5):
Solar energy from a hybrid inverter that manages both your solar panels and your battery. FlexiO can actively control this inverter (for example, for curtailment during negative injection prices). -
PV retrofit production (4):
Solar energy from an additional, regular inverter that FlexiO only monitors. FlexiO cannot actively control these retrofit inverters — they are simply measured.
How are retrofit inverters measured?
-
A separate additional meter is required to accurately measure the production of a retrofit inverter.
-
If no extra meter is installed, FlexiO will estimate the retrofit production based on panel orientation, peak power, and location.
Multiple retrofit inverters:
-
FlexiO can only read one retrofit meter.
-
If you have several retrofit inverters, they must be connected behind the same additional meter.
-
If no meter is installed and multiple retrofit inverters exist, FlexiO will only show an estimated total production for all retrofit systems.
In the app, the production from hybrid and retrofit inverters is always displayed separately.
Important: Can I see grid injection here?
No, this graph only shows the solar production.
If you want to check how much solar energy was sent back to the grid (injection), please refer to the Grid graph.