
Overview
The Monthly Health Score view is available in the Device Info Page (DIP) and gives partners a month-by-month indicator of a device’s health trend.
-
The health score is generated monthly.
-
Only the months after the first month of device activation are relevant and are shown.
Where to find it
-
The Monthly Health Score view is an additional tab or section within the Device Info Page.
-
Navigate to the relevant device in your portal, then open the Monthly Health Score (or Health Score) section to see the latest months.
Severity indications ✅ ⚠️ ❌
The Monthly Health Score uses the same three severity states as other DIP health/status screens:
-
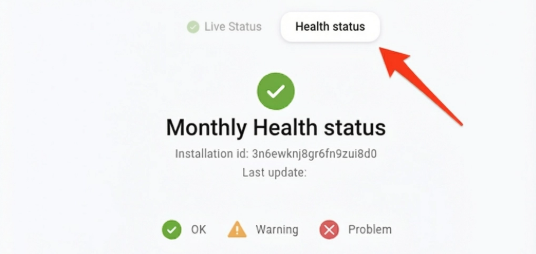
✅ OK — no issues detected for the most recent month.
-
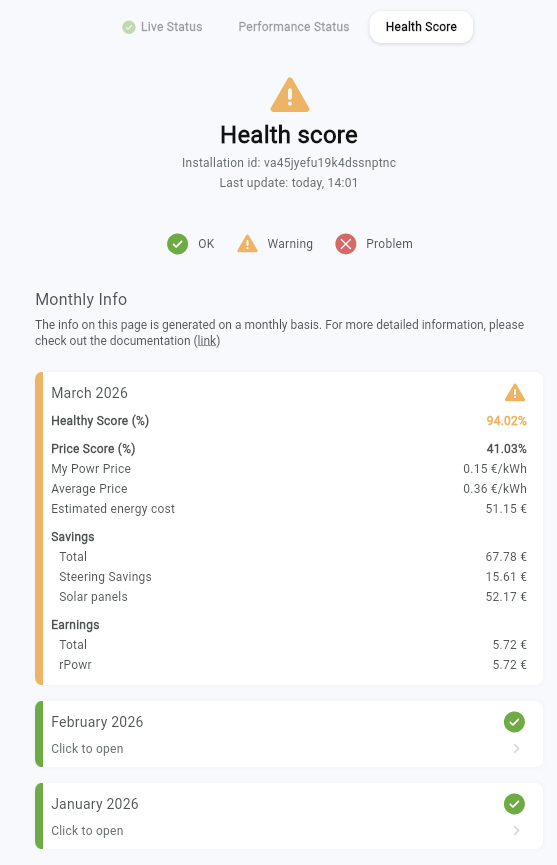
⚠️ Warning — warnings detected for the most recent month.
-
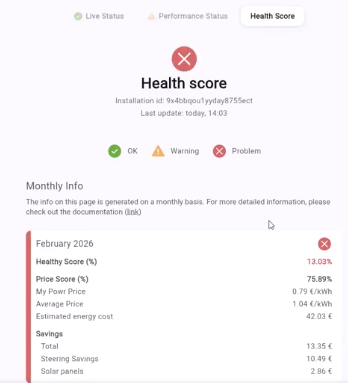
❌ Problem — errors/problems detected for the most recent month.
⚠️ Important: Only the most recent month determines the top-level severity icon shown for the view.
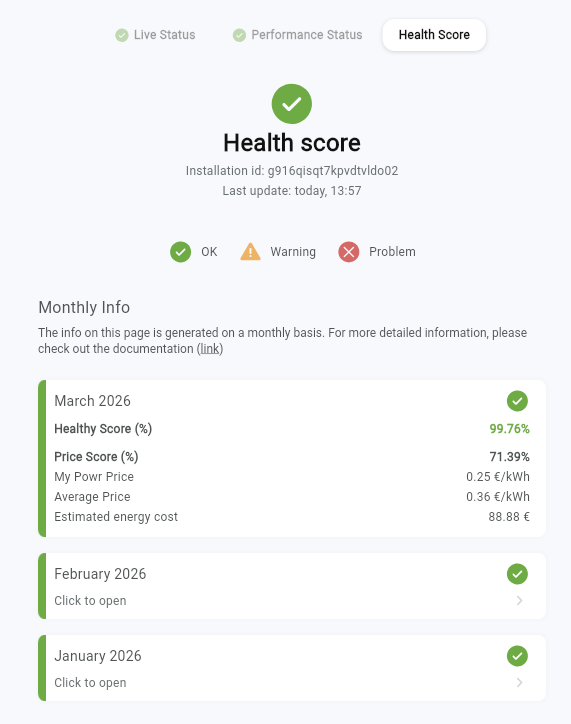
Example ✅ OK
Example ⚠️ Warning
Example ❌ Problem
Energy consumption to reference price ratio
The individual price is compared to the reference price. We use a rule of thumb to determine a good price:
-
In summer, it should be lower than 30% of the reference price
-
In winter, it should be lower than 70% of the reference price
-
In spring and autumn, it should be lower than 40% of the reference price
If this is OK, then we show it as green. If it’s higher, then we show it as amber, or red if it’s higher than the reference price.
The seasons are determined by the PV to usage ratio:
-
More PV than usage: summer
-
PV higher than 1/2 of usage: spring and autumn
-
PV lower than 1/2 of usage: winter
Monthly Health Score list
Which months are shown
-
The list is grouped by the last 3 months (descending).
-
By default, the most recent month is expanded and the other months are collapsed.
-
Months on or before the activation month are not shown as data. Instead, show:
-
“Data is only relevant starting from the month after the device is been activated (Activation Date = dd/MM/YYYY)”
-
Fields shown per month
Health Score field
The Health Score is shown as a percentage for each month. This score is based on two main parameters:
-
The online state of the FlexiObox during the period of the month
-
The successful creation of setpoints by the EMS to steer the assets with the EMS-mode on Normal.
-
⚠️ Important: the Health Score only provides insight into the creation of setpoints by the EMS, it does not reflect if the setpoints were correctly followed by the assets. This last point will be reflected in the Performance Status of the Device Info Page.
-
MPP fields
-
Price Score (%) — calculated value: My Powr Price / Average Price The individual energy consumption price (MPP) is compared to the reference/average market price. The lower the ratio, the better, it means the device is consuming energy cheaply relative to the marketThe threshold for “good” is determined by the season because a lot is depending on the amount of available solar production.
-
Summer: a good price score is defined as lower than 30%
-
Spring/Autumn: a good price score is defined as lower than 40%
-
Winter: a good price score is defined as lower than 70%
-
-
My Powr Price The actual price per kWh the end-user effectively paid for their energy that month. It is their total energy cost divided by their total consumption. It already factors in the earnings from grid balancing (FCR/Imbalance) so it reflects the real net cost after all savings and earnings.
-
Average Price This is the market reference price per kWh, plus the capacity tariff cost of the end-user spread over the total consumption of the end-user. It represents what the end-user would have paid per kWh without any optimization.
-
Estimated energy cost The customer’s total net energy spend for the month. This is their estimated energy bill minus any earnings out of grid balancing of that month. It represents the actual monthly cost (in euro) for the end-user.
Savings & Earnings fields
-
Savings
-
Savings total The total money saved compared to what the end-user would have paid without a EMS installation.
-
Steering Savings The savings that can be attributed to the steering, without the solar production.
-
Solar panels The savings attributed to the production by the solar panels. This is the value of the solar energy that was self-consumed plus the value of any excess solar that was injected back into the grid.
-
-
Earnings
-
Earnings total The total money paid out to an end-user for participating in grid balancing markets.
-
ePowr Earnings for participating in the Imbalance market for end-users with an Imbalance applicable energy tariff.
-
rPowr Earnings for participating in the FCR market
-