Overview
The Site Performance view is available in the Device Info Page (DIP) and gives partners direct visibility into performance errors and warnings detected on a device. It allows you to quickly identify and resolve issues that may impact a site's performance.
The performance checks run automatically every day at night (before business hours). Results are refreshed daily and reflect the most recent analysis period for each check.
Where to find it
The Site Performance view is an additional tab or section within the Device Info Page.
-
Navigate to the relevant device in your portal, then open the Site Performance section to see the current list of active issues.
-
If no issues are listed, the device is operating within expected parameters for all monitored checks.
Site Performance issue list
Each issue shows:
-
Name — a short description of the detected problem
-
Type — severity of the issue:
Error,Warning, orInfo -
Category — the system area affected (General, Battery, Load)
-
Description — what the issue means and what may be causing it
-
Suggested action — what you as a partner can do to resolve it
-
Documentation link — a link to the detailed troubleshooting page
Issues are calculated over a defined data window (either 24 hours or 7 days, depending on the check). This is noted per issue below.
Site Performance not visible
-
When the device is not activated yet: the tab will not be visible
-
Device is activated recently and no data is available: a message will be displayed “Site Performance not available yet (please try again tomorrow)”
-
When the device is not available: a message will be displayed “Site Performance not available yet”
Severity indications ✅ ⚠️❌
Use the examples below to recognize the new Performance Status view and its three severities.
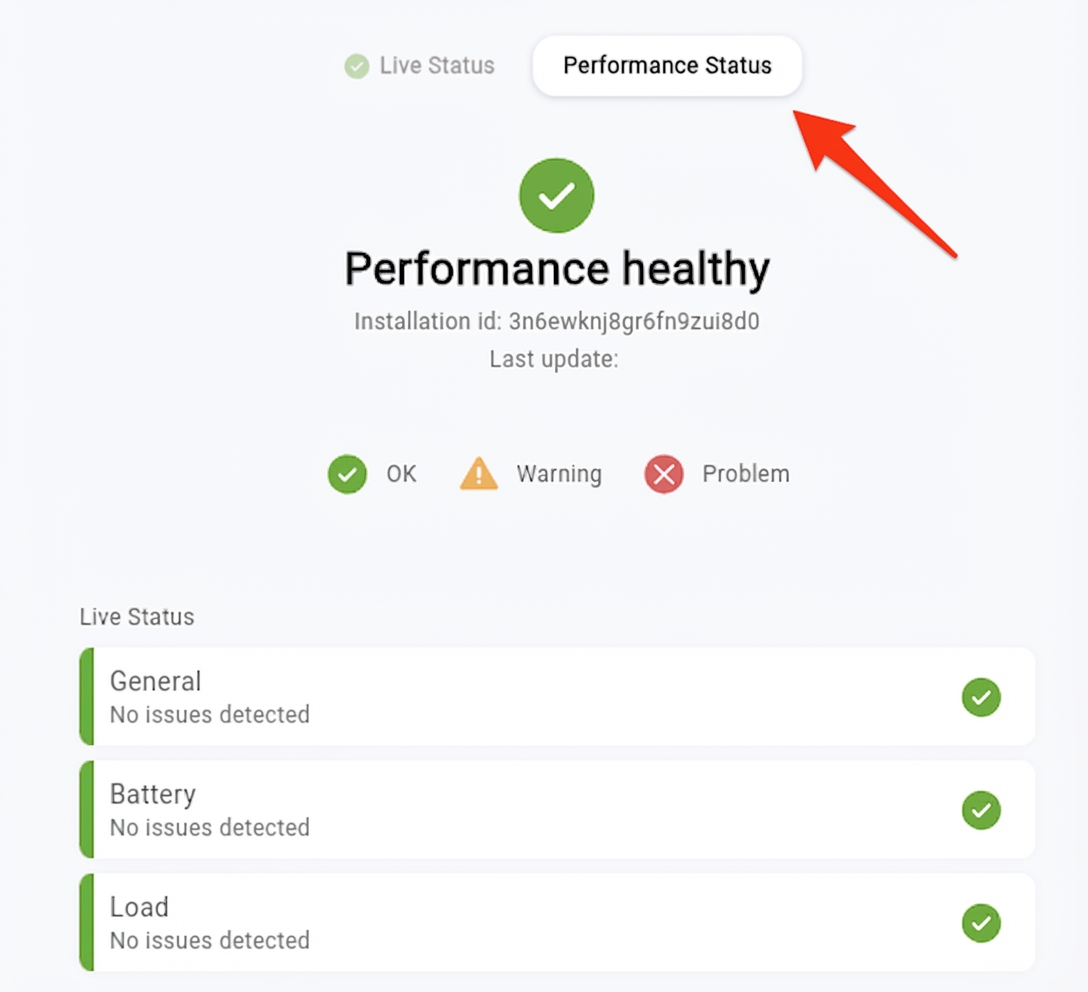
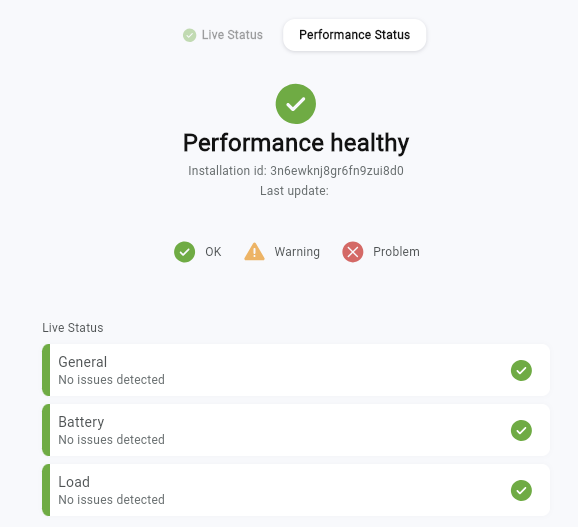
✅ OK — Performance healthy
-
Shows the Performance Status tab and overall state OK.
-
All sections (General, Battery, Load) show No issues detected.
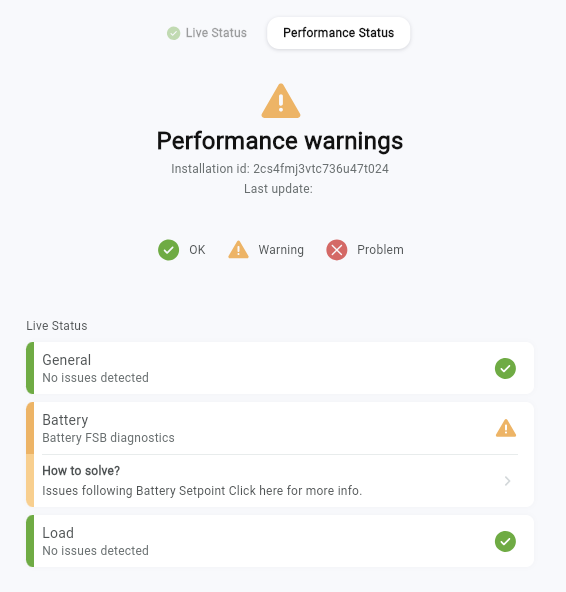
⚠️ Warning — Performance warnings
-
Shows the Performance Status tab with state Warning.
-
At least one section (e.g., Battery) contains a warning check (example: Issues following Battery Setpoint).
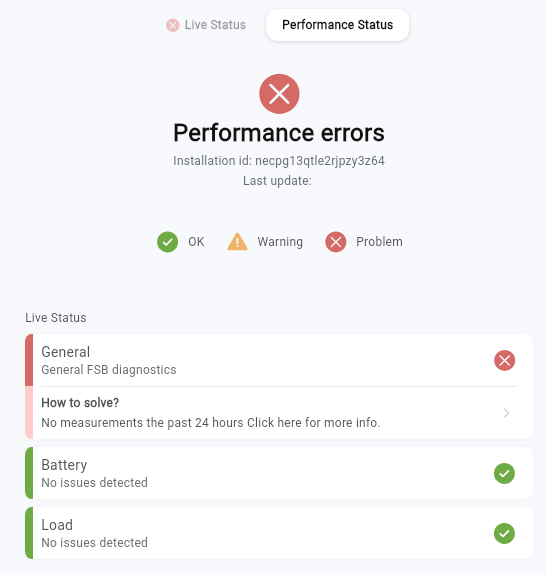
❌ Problem — Performance errors
-
Shows the Performance Status tab with status Problem.
-
At least one section (e.g., Load) contains an error check (example: Positive load (retrofit/hybrid)).